#IMDb Graphs
Explore tagged Tumblr posts
Text
IMDb Graphs 📉📈
Hi Anne - Graph Girl with the numbers for a bit of math fun.
He drops 28 to spot 64 this week. Still a good spot. Not unexpected as Deadpool and Wolverine press slows down. Shooting for Sacrifice starts in September, Red One moved to November 6th release so busy months ahead.

The It Ends With Us release moves people up. Blake Livey moves up 1 to spot 4. Jenny Slate moves up 303 to spot 12. Justin Baldoni moves up 207 to spot 10.
Deadpool and Wolverine starts to taper off for the men but the women hold. Dafne Keen holds at spot 2. Emma Corrin holds at spot 1. Ryan Reynolds drops from 3 to spot 7. Hugh Jackman drops 5 to spot 13.
SDCC announcements have now slowed down for others. RDJ drops 79 to spot 88. Pedro Pascal drops 43 to spot 82. Florence Pugh drops 51 to spot 113. Anthony Mackie drops 1,314 to spot 2,042. This is an outrage.
Sydney Sweeney drops 3 to spot 24. And a toe drops out of the top 10. Run along little piggy. 🤭
She goes up 56 to spot 1,027. Higher than Mackie who out is out there promoting Cap4. And there is nothing new to report for her. I think we can all see the level of BS that is happening here. But God forbid we call that out when we see it.


Wow, I didn't expect her IG like would have such a huge impact. 😂😂😂
Drama boy drops 19,201 to spot 153,138
Joana goes up 492 to spot 17,236
Amanda goes up 388,647 to spot 713,775
21 notes
·
View notes
Text
Colin Firth
My first unhinged project involved watching all of Colin Firth's IMDB acting credits, to see how often he got wet.
Figured I'd make a master list of the posts I made. I didn't make a post on everything, so if there's one without a link you can always request to hear my thoughts hahaha
I also made a post about his hair choices, because he does a lot of period pieces and oh boy do I often have Thoughts
And here's a post about how his trend of getting wet changed our perception of Darcy forever
I ended up making a powerpoint presentation of my data (that I drunkenly presented to my friends, highly recommend) and put it in posts here: Intro Graphs and Data Influence
1917 (2019)
1919 (1984)
The Accidental Husband (2008)
The Advocate/Hour of the Pig (1993)
And When Did You Last See Your Father (2007)
Another Country (1984)
Apartment Zero (1988)
Arthur Newman (2012)
Before I Go To Sleep (2014)
Blackadder Back and Forth (1999)
Born Equal (2006)
Bridget Jones Diary (2001)
Bridget Jones: Edge of Reason (2004)
Bridget Jones' Baby (2016)
Bridget Jones: Mad About the Boy (2025)
Camille (1984)
Celebration (2007)
A Christmas Carol (2009) Intro, Movie
Circle of Friends (1995)
Command (2018)
Conspiracy (2001)
Crown Court episode (1984)
Deep Blue Sea (1994)
Devil's Knot (2013)
Donovan Quick (2000)
Dorian Gray (2009)
Dutch Girls (1985)
Easy Virtue (2008)
Empire of Light (2022)
The English Patient (1996)
Femme Fatale (1991)
Fever Pitch (1997)
Fourplay/Londinium (2001)
Gambit (2012)
Genius (2016)
Girl With a Pearl Earring (2003)
The Happy Prince (2018)
Hope Springs (2003)
Hostages (1992)
Hour of the Pig/The Advocate (1993)
The Importance of Being Earnest (2002)
The King's Speech (2010)
Kingsman: Secret Service (2014)
Kingsman: Golden Circle (2017)
Last Legion (2007)
Lockerbie (2025)
Londinium/Fourplay (2001)
Lost Empires (1986) Intro, Pt 1, Pt 2, Pt 3, Pt 4, Pt 5, Pt 6, Pt 7
Love Actually (2003)
Magic in the Moonlight (2014)
Main Street (2010)
Mamma Mia! (2008)
Mamma Mia! Here We Go Again (2018)
Mary Poppins Returns (2018)
Master of the Moor (1994) Pt 1, Pt 2, Pt 3, Pt 3 Finale
The Mercy (2017)
A Month in the Country (1987)
Mothering Sunday (2021)
My Life So Far (1999)
Nanny McPhee (2005)
Nostromo (1996)
Operation Mincemeat (2021)
Out of the Blue (1991)
Pat Hobby Teamed With Genius (1987)
Playmaker (1994)
Pride and Prejudice (1995) (I didn't make a single post, it got a bit away from me so you can find the collection of links on my Pride and Prejudice masterlist)
The Railway Man (2013)
Relative Values (2000)
The Secret Garden (1987)
The Secret Garden (2020)
The Secret Laughter of Women (1999)
Shakespeare in Love (1998)
A Single Man (2009)
St Trinians (2007)
St Trinians 2: The Legend of Fritton's Gold (2009)
The Staircase (2022)
Stars in Shorts (2012)
A Summer in Genoa (2008)
Supernova (2020)
Then She Found Me (2007)
A Thousand Acres (1997)
Tinker Tailor Soldier Spy (2011)
Trauma (2004)
Tumbledown (1988)
Turn of the Screw (1999)
Valmont (1989)
What A Girl Wants (2003)
Where the Truth Lies (2005)
The Widowing of Mrs Holroyd (1995)
Wings of Fame (1990)
23 notes
·
View notes
Note
I saw a post about Jackie doing an interview with esquire and talking about Chris and his time with the mcu and possibly not coming back. With the way marvel works, I am sticking to it still being a rumor unless there is a real official announcement. Because even in the just Jared post you did of that article from his weekend in Vegas, it says he is rumored to be in the doomsday film and that doesn’t mean it’s confirmed. So I’m just going to sit and wait.
They've always been "rumors" of course, but...it's been a bit gray area. So there are a few things that we do know. The Wrap released his return on 12/9 at 3:00pm, and nobody thought too much about it because of the publication. Deadline ran an article about his return at 3:38, and minutes later his IMDb was updated. Here's the thing, instant updates such as that cannot be done by just anyone with an account. IMDb does verify people's claims of being in a movie. Thanks to the IMDb graph anon for providing me with information and timestamps. We also got some information on a production sheet that Chris was listed in the cast. His IMDb has yet to have him removed as well.
Now, let's take a step back and look at what movie is about to be released, Captain America Brave New World. If Chris made an official announcement what would the thought be? He's coming back as Steve/Cap. Well, Mackie is Captain America. The new movie is coming out, that's muddying some waters here. And Mackie did do an interview talking about RDJ's announcement at SDCC, and while it was in a joking manner, I don't think he liked that overshadowing.
Mackie and Cap4 has gotten shit on since day one. I don't think Marvel has been taking the care for that movie that they should. So how confusing would that be for casual Marvel fans. If there is an official announcement I don't expect it before Cap4's theatrical run. Maybe we get a pap walk of him on set, maybe it's nothing.
Now, we have the quote in Mackie's Esquire interview. Which pissed me off anyways because this is about Mackie, why are we asking him about Chris coming back? They never let this man shine, but I digress. Chris' words are extremely careful, "Evans denied recent reports that he will be returning as Steve Rogers in 2026 Doomsday. 'That's not true. It happens every couple years. I've just stopped responding to it.'"
To me this is careful wording that he will not be returning as Steve Rogers, that doesn't exclude him returning as a variant. As far as the "retired" comment, it could very well mean he retired the shield/retired as Steve Rogers. We even have Benedict Cumberbatch admitting he lied that he wouldn't be in Doomsday. So sometimes they're just keeping things under wraps.
Now obviously it is speculation. I actually had a feeling that the return was leaked, especially since it was from The Wrap. He could return in Doomsday, he could not return. But in my mind, where there's smoke there's fire.
There were rumors abound of him appearing in Deadpool and Wolverine. In fact I started talking about it in 2023. Heavily talked about it in 2024. And people denied the fact he was in it until we saw he was. I think there's a lot of evidence backing it up that he will return, but we just have to wait and see.
3 notes
·
View notes
Text
CM Fanfiction on AO3
I'm a bit of a stats nerd, and I've been wanting to put this together for ages. The following are some statistics regarding Criminal Minds fanfiction of AO3. Do with this what you will, but if ever someone tries to tell me this fandom isn't misogynistic -- I will just point to this post.
I spent an abhorrent amount of time putting this together, hope it's interesting to other people. Please don't send me hate mail for my opinions.
Base Statistics
Total Fics Tagged Criminal Minds: 34,561
These stats were compiled by me on 20/06/23 via AO3's filtering system.
Note: These were taken at face value, meaning these numbers may not be exact. In order to get exact statistics, I'd have to stringently filter out things like mislabelled fics, spam, fics with multiple categories (to find pure slash, femslash fics), etc.
Tumblr will destroy the resolution of the graphs, just click to see full res :)
Fanfic statistics gathered from AO3, episode totals gathered from IMDB.

CM Fanfiction by Category
Most Popular Category: F/M (26.2%)
Fics Counted in This Statistic: 34,561
These totals weren't all that surprising, in a fandom that is largely obsessed with two men and no one else, I sort of expected this.
The only reason F/M has the largest amount of fics (vs M/M) is because 37% of all F/M fics are "Spencer/Reader". (More about pairings below)
If 'x reader' fics were excluded from the data, then the distribution would skew to: 34% M/M vs 24% F/M
Sorry, I just saw the 'other' category is the same colour as F/M on the graph. Other accounts for 2.3% of all fic categories

CM Fanfiction by Rating
Most Popular Rating: Teen and Up (30.3%)
Fics Counted in This Statistic: 34,561
I think it's interesting that the most popular ratings are Teen and General -- even though a huge portion of readers only read Mature/Explicit. There are absolutely incredible works that are rated Teen and General, and it's just a shame people don't read them as much as smut. That's probably the same in most fandoms though.
Top Relationships for Each Rating: General Audience: Spencer/Reader Teen and Up: Morgan/Reid Mature: Hotch/Reid Explicit: Hotch/Reid Not Rated: Spencer/Reader
It's no secret that this fandom worships Hotch and Reid above all other characters, but I think there's something to be said that a M/M ship dominates the Mature and Explicit ratings. Slash fic (M/M) has always been more popular than femslash (F/F) in pretty much any fandom, and the history of fetishization of mlm relationships in fanfiction (the fetishisation usually being written by cishet women, not talking about queer people writing queer fic) is always worth discussing.
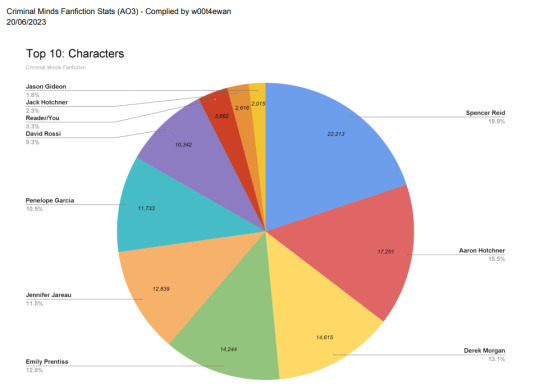
CM Fanfiction - Top 10 Characters
Most Popular Character: Spencer Reid (19.9%)
Fics Counted in This Statistic:*indeterminate due to crossover (multiple characters per each fic)
No surprises here with the top three being the men who make up some of the most popular ships.
Notice how Jack Hotchner, a CHILD who was in 22 eps out of 300+ -- is featured in MORE fics than main characters (who were in multiple season) like: Luke, Matt, Tara.
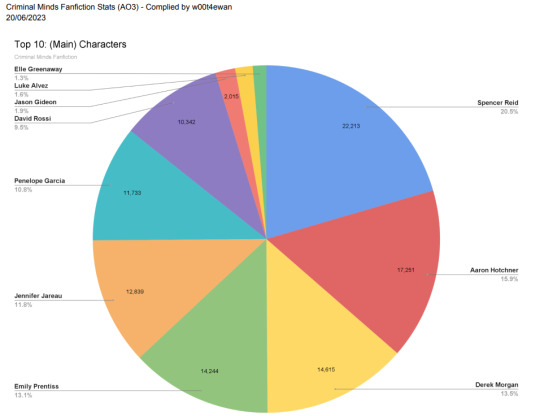
CM Fanfiction - Top 10 (BAU) Characters
Most Popular Character: Spencer Reid (20.5%)
Fics Counted in This Statistic: *indeterminate due to crossover (multiple characters per each fic)
This one is filtered by BAU members only. Sorry, 'reader', this is about main characters only.
Notice how Gideon (45 total episodes, 2015 fics) and Elle (27 total episodes, 1371 fics) made the top 10 list even though characters who were on the show for YEARS missed out.
Main Characters not in the Top 10: (* denotes section chiefs. Bold denotes characters who appeared in more episodes than Gideon) *Erin Strauss (24 total episodes, 1361 fics) Alex Blake (48 episodes, 1190 fics) Tara Lewis (97 episodes, 1108 fics) Matt Simmons (49 episodes, 642 fics) Ashley Seaver (13 episodes, 279 fics) Kate Callihan (23 episodes, 247 fics) Jordan Todd (8 episodes, 130 fics) *Mateo Cruz (6 epsiodes, 88 fics) Stephan Walker (15 episodes, 66 fics)
All three men who didn't make the Top 10 are men of colour. Which is worth pointing out because the main reason Derek and Luke both made Top 10 is because they are popularly shipped with Reid. Outside of Morgan/Reid and Reid/Alvez -- I doubt they would have been tagged as much as they are.
Also worth nothing that Tara Lewis who appeared in 97 episodes, which makes her the EIGHTH highest billed character (above Luke, Gideon and Elle) -- doesn't even make the Top 10 most written about characters. She also happens to be the ONLY Woman of Colour on this list. Coincidence? Doubtful. She's also the ONLY canonically QUEER character -- and yet....even in the F/F tag she doesn't make top 5 (more about ships below)
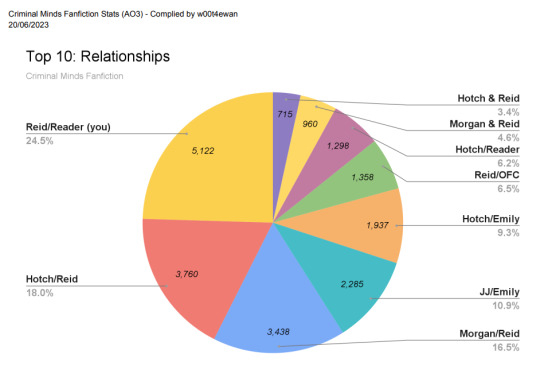
CM Fanfiction - Top 10 Relationships
Most Popular Pairing: Reid/Reader (24.5%)
Most Popular Character Ship: Hotch/Reid (18%)
Fics Counted in This Statistic: 20,873 out of 34,561 (*includes fics with multiple pairings tagged)
This was WILD to me. I knew that 'Spencer x Reader' fics (I grouped ones tagged 'reader' and ones tagged 'you' together for this graph) were popular but I wasn't prepared for how skewed this data was. I don't have much to say about it anything involving Reid tbrh
Only three out of ten top relationships DO NOT involve Spencer Reid.
For people who don't know: using a slash ( / ) to denote a pairing means the pairing is romantic, using the ampersand (&) to denote a pairing generally indicates a non-romantic relationship.
Notice the ONLY F/F pairing that made Top 10 was JJ/Emily (with only 10%)

CM Fanfiction - Top 5 M/F Relationships
Most Popular Relationship: Spencer/Reader (52%)
Fics Counted in This Statistic: 9741 (72% of the total F/M fics on AO3)
Look, I don't know what to say about this. It speaks for itself. This show had an incredible ensemble cast who were all integral to the show's success -- yet, the only character anyone cares about in the fandom is the generic white dudes. Misogyny at it's best.

CM Fanfiction - Top 5 M/M Relationships
Most Popular Relationship: Hotch/Reid (45%)
Fics Counted in This Statistic: 7870 (75% of the total M/M fics on AO3)
Again, no comment about the most popular ships
I was, however, surprised that Hotch/Rossi made Top 5
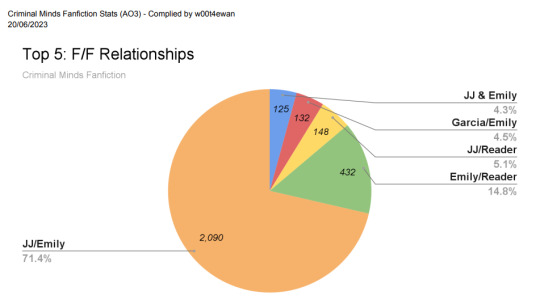
CM Fanfiction - Top 5 F/F Relationships
Most Popular Relationship: JJ/Emily (71%)
Fics Counted in This Statistic: 2927 (65% of the total F/F fics on AO3)
For people who don't know: using a slash ( / ) to denote a pairing means the pairing is romantic, using the ampersand (&) to denote a pairing generally indicates a non-romantic relationship.
It's not surprising that JJ/Emily dominate the femslash category. They have always been the main femslash pair in this fandom. However, they only make up 49% of all F/F pairings!
I was surprised to see that 'x reader' fics took 2 out of 5 slots on this one. And I was especially surprised that Emily/Penelope made top 5. (I mean it's only 148 fics, but there they are)
Again, note how Tara Lewis (a canonically sapphic character) isn't a part of ANY of the top 5 pairings, even though she was in 98 episodes. That's a travesty imo. Tara/Emily trails at about the 7th most popular F/F ship with a mere 115 fics
In Conclusion...
Most of this was to be expected. This fandom has always praised the male characters while pushing the women aside, so the amount of works focusing on Reid and Hotch wasn't that surprising.
I think it's interesting how people tend to throw Jemily shippers under the bus (broad statement made via my 18 years in this fandom), because Femslash is by far the smallest portion of the shippers in the entire fandom. People just hate women
Do with this information what you will. This was mostly compiled because I've always been curious, and also I think it serves as an important archival tool for the fandom.
Please don't send me hate mail for my opinions.
Word Count & Additional Tags Information Below Cut
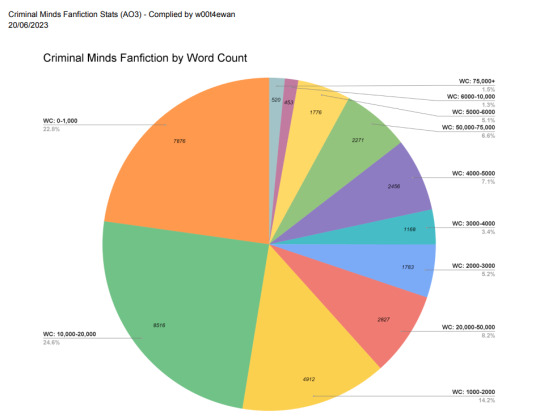
CM Fanfiction by Word Count
About 52% of all CM fics (34,561) are under 5,000 words
This was a really fun one to do, and was mostly included because I was curious. I think it'd be worth getting even more specific by trying to work out the average word count for all fics under 5,000 words.
Hey, if you're a marathon author with long works -- look at YOU!! You're a very small percentage in this fandom, and as someone who prefers long-form fic -- I am personally thanking you for your dedication.

CM Fanfiction - Top 10 Addition Tags
Most Popular Tag: Fluff (21.7%)
Fics Counted in This Statistic: *indeterminate due to crossover (multiple tags per each fic)
I honestly expected angst/whump/hurt/comfort to be first on this. I guess if you add up all the variations of those type of fics, they'd be top tag.
Obviously this one isn't ever going to be perfect, because tons of people either don't tag their fics, or they don't use the prescribed tags above. Still, I thought this was worth adding to the post.
For more stats please see my, [Tara Lewis Fic Stats Post]
#criminal minds#spencer reid#aaron hotchner#derek morgan#emily prenitss#jennifer jareau#penelope garcia#luke alvez#tara lewis#criminal minds fandom#criminal minds fanfiction#cm fanfiction#cm reference#master post#ao3 stats#cm commentary#cm meta
70 notes
·
View notes
Note
ok literally i spent all of s4 wondering why kiara’s boobs were always out lol like was it really necessary. and she didn’t dress like that in previous seasons to my memory?
Yeah it was super strange and the clothes in general from kinda s3 on started to feel way more fashion focused rather costumes for the girlies this season rather than feeling like real clothes (except maybe Cleo). It's probably just a result of the show getting more popular and wanting to look cool it happens with most teen shows but it feels kinda ick. There's also a couple moments where Fiona isn't wearing a bra and you can tell and I'm like who let that through the finally fitting check? Let her have some stick on covers at least, bro? IMDb doesn't say the costume designer has changed but idk the vibes are off.
I really need to make a "the trajectory of teen shows" graph and plot OBX on it cause it's hitting all the usual peaks and troughs
#obx#Madison Bailey#madeline cline#Fiona palomo#I'm so on edge from all the drama around OTH and other shows I feel paranoid#protect them at all costs
5 notes
·
View notes
Note
Rotten tomatoes was never place for objective opinions and highly politicized. To often films with bad rating can turn out good and vice versa. User verified score highly manipulated too, studios by our seats and leaving reviews by bots. Score not change at all from 100 reviews to 5000+ like try find someone who will believe this. I saw film and it's definitely not 95% and not 50% all audience score truth something in between. Cinema score and IMDb usually much closer but this time ppl there just tired from Disney cash grab and race swap instead of creating own black characters. Nobody there against black panther or miles morales if u look bo tracking. Just food for the mind. Disney will lose money on this one and unfortunately for Halle she was great.
Rotten tomatoes was never place for objective opinions and highly politicized. To often films with bad rating can turn out good and vice versa.
That can definitely be true.
User verified score highly manipulated too, studios by our seats and leaving reviews by bots. Score not change at all from 100 reviews to 5000+ like try find someone who will believe this.
That's probably true, but I'm more likely to believe the "verified" reviews from people they can prove that actually SAW the movie, and aren't just rating the movie w/out seeing it because they're haters. 🙄
Cinema score and IMDb usually much closer
IMDB.com is highly manipulated as well. Just look at the graph of the ratings on certain films. For a lot of "Black" films, the graph doesn't resemble a bell curve (like most normal graphs), but more so resembles a field goal.
but this time ppl there just tired from Disney cash grab and race swap instead of creating own black characters.
Funny how people are just NOW tired of Disney's "cash grab", when just about EVERY single movie that Disney puts out is for a "cash grab".

Nobody there against black panther or miles morales if u look bo tracking.
First of all, a mermaid is a fictional and mythical character. It's not real. Nor is Ariel real. Funny how nobody has any issues when white actors have played people of color in certain films:
Scarlett Johansson - Ghost in the Shell
Rooney Mara - Pan
Katherine Hepburn - Dragon Seed
John Wayne - The Last Conqueror
Ben Affleck - Argo
Fred Astaire - Bojangles of Harlem
Majority of the Cast - 21
Lara McDonnell - Artemis Fowl
Liam Neeson - Batman Begins
Kris Kristofferson - Blade I & Blade II
Laurence Olivier - Othello
Majority of the Cast - Exodus: Gods and kings
Mickey Rooney - Breakfast at Tiffany's
Angelina Jolie - A Mighty Heart
Just to name a few.....
See..... Y'all don't seem to be upset when it's the other way around....even when the film is about ACTUAL real people in history. 😒
Just food for the mind. Disney will lose money on this one and unfortunately for Halle she was great.
Disney hasn't lost a single thing. The movie JUST made nearly $180 million it's FIRST opening weekend, and is the 5th highest-grossing film for Memorial Day Weekend at the box office lol. 😅
It's not a flop by any means. It's not going to gross as much as an MCU/Marvel movie, but I predict that it's going to make back what it took to make the film and more.
11 notes
·
View notes
Text
If I currently had the funds to re-up my IMDB Pro package, among other things, I would not be using it to peddle "industry insider information" for a fucking monthly subscription fee on fucking Patreon. I would offer up the interesting and harmless bits for free. Like I already did with TZP's star rating graph. Anyway, when I get my tax refund, maybe I'll splurge on that because it was an expense I'm temporarily cutting due to the financial hardship of my life going to shit left and right, and that's why I can't have nice things right now.
2 notes
·
View notes
Link
0 notes
Text
I absolutely love this not just for the choice of data or data presentation (which are both great), but because I had the same idea and actually created my own version of this a few months ago. Three things:
1) you don't need to include the preeminent's roars in The Kaiju Protocol, since Gayle and PIXAL have a brief exchange
2) I'm not sure how The Turn of the Tide passes unless you're including Wojira's roars too?
3) dragons rising season 2 part 2 keeps up the strong trend, with only one episode definitely failing as far as I can tell
You mentioned that it became easier to find meaningful dialogue as the show went on, and this was actually something I graphed when collecting the data.
0 = failed all 3 prongs of the test
1 = failed 2 prongs
2 = failed 1 prong
3 = passed the test barely (the characters "interacted" but not really directly)
4 = passed the test (the characters had a defined dialogue, if brief)
5 = solidly passed (both characters had multiple lines of dialogue to each other).

It's good to see things have gotten better.
Another interesting thing is that if you graph the % of episodes in a season that pass the test vs the season's average IMDb rating, there's a clear (although not really statistically significant) trend where seasons with more female rep have higher IMDb scores. clearly, representation does not harm shows (wow! big shock), although ofc both the bechdel test and IMDb are imperfect measures.
analyzing stuff like this is ridiculously interesting and I'm super glad there's someone on here doing this!
Bechdel Testing Ninjago

So, a little while ago I did the Bechdel test on Ninjago because I've always seen the show as sort of an interesting case study in how women are portrayed in cartoons. Of course, I'm aware the Bechdel test originated as a joke and something passing the Bechdel test doesn't make it feminist/not. Rather, or for me at least, it's an indication of how deficient female representation can be at an aggregate scale. As a way to analyze Ninjago, I feel it works as it shows how female representation over the course of the show. If you're interested I'll now discuss my thoughts on how the analysis went season by season. DISCLAIMER: I did this for fun.

The pilot was easy. Nya's the only one, so test failed across the board. The first episode that passed the test was when Jay's parents came to visit. Yay Edna! Mystake does show up in episode 7 but, I don't count it as she has not yet been named. 12&13 had a kid's mom in a bus which I decided was enough cus hey, Mom's a name she uses.

Here's where we really get going. Patty Keys, their real estate agent continues to show up through seabound as a background character, which is pretty cool imo. Episode 5, Mystake finally gets named. Episode 6 was huge for my chart as it's the introduction of Misako. You'd think episode 7 is when her and Nya talked but that's actually when Nya and Gayle had a lil convo. From then on I spent the episodes just staring at the Nya and Misako thinking "talk to her talk to her talk to her." Fortunately, when they did speak, Nya and Misako would be discuss like science, maps, and fate of the world so I never ran into a problem with rule 3. That is, until Rebooted.

The good news is Pixal's here so it'll be years before we fail rule 1 again. The bad news is we've got a love triangle so goodbye rule 3. Nya actually talked to her student, Sally, and Pixal quite often but it was so often about Jay or Cole so I would just be scouring the episode for a single exchange where they talked about anything else. During the Tournament, Nya, Pixal, Skylor, and Misako were all in different groupings and it was rare that Tox or Camille would say something so no rule 2/3 successes until late season.

The good news is, the love triangle is over so we're back to rule 2 usually meaning rule 3. The bad news is, Pixal's in Zane's head so we're back to hoping Misako and Nya say something to eachother. Nya usually shared her scenes with Wu, Ronin, and Jay during these seasons so chances were few and far between. However, unlike the first few seasons where the default was male, we're now getting some female henchmen (Bansha and Dogshank) so that made things easier.

Thank you for being in Day of the Departed Edna Walker. Early Hands of Time was tough because Nya, Misako, and Commander Macchia were rarely in the same scenes. In the latter half of the season though, we thankfully see the return of Pixal. Maya also helped us with some wins.

What a breath of fresh air. Thanks to Harumi & Ultraviolet's introduction, Pixal's return, Mystake's upgrade to a reoccuring character, and Nya & Misako's continued support, failing even rule 3 is pretty rare during the Oni Trilogy. We run into some complications during Hunted because though we have Skylor and the aforementioned characters in Ninjago and Faith & Jet Jack in the First Realm, sometimes people don't talk to eachother. And that's ok. Overall, smooth sailing.

Ah??!? What happened. Worry not. I realized this was, in part, because the Oni Trilogy had 20 minutes worth of chances for women to speak to eachother, these were only 10 minute episodes. So, for the sake of comparable units of analysis, I considered each pair of episodes to be 1 episode. I'll show both charts until DR.

It looks a little better, but it's still not at Oni Trilogy levels. Still, I'd be curious to see what the test would look like if I dissected the earlier episodes into 10 minute chunks because it's probably not a great sign if 10 v 20 minutes makes such a big difference. Ok, proceeding. The Fire Chapter was usually pretty successful because Pixal, Aspheera, or Nya would usually end up talking at one point or another. Gayle even helped at one point. The Ice chapter usually achieved successes through Nya talking to Sorla. In one episode, I counted the Preminent's roars as conversation with Pixal. The Ice Chapter had quite a few failures largely because, as in previous seasons, all the women were split up.


Despite the fact that Nya was one of the longest lived ninja, Prime Empire has total failures at levels not seen since before season 2. This is largely because for the most part, Pixal and Nya are never in the same episode. Racer 7 helps but she was only there for a bit. I should point out that I feel like the 10 minute era is really when Pixal starts feeling like part of the team to me. She's always part of homebase meetings and always plays a key part in missions. Alas, if she's not in episodes with Nya, that's not going to show up on my chart. It's a reminder of the fact this test doesn't show substance.


Master of the Mountain is similar to the other seasons of its era. The fact the 10 minute era tended to show its plots episode by episode (ex: Ep 3 = Plot A, Ep 4 = Plot B, Ep 5 = Plot C) rather than all in one really takes a toll on the test. For the most part, Nya and Vania were our only chances for success and it was rare they'd share an episode. We also had the rare rule 3 failure with the Queen of the Munce episode. Thanks Jay. The Island only had Nya until they found Misako, so it was struggling even more.


It feels right to see all green when it's a Nya season. In the beginning of Seabound, they put Nya, Pixal, and Maya on a boat together and by jove it made things easy. Late season was a bit trickier because Nya was on her own journey. Crystalized had Skylor, Pixal and some ressurected villains saving the day. Late Crystalized is the way it is because it had so, so many different groupings. I have a chart based on groupings and this season was such a challenge.

I really felt the difference with Dragons Rising. I mean, you can see the difference, but it was even more clear when doing my data collection because it was just so easy. Rather than grabbing at scraps of dialogue like I had to do in early seasons, there was often a wealth of more meaningful conversation between female characters to choose from. As with the Oni Trilogy, a female villain with a female henchman makes things easy because they scheme together. We also had Nya and Sora on a joint quest. Funnily enough, there is a rare rule 3 failure because Sora and Kreel only talked about Kreel's friend in one episode. Episode 17 had the classic split up issue and actually would've failed entirely if not for Agent Underwood, which is actually a great example of my next point. You can really tell how male is no longer the default because not only is there the introduction of all the fantastic new female main characters, but also there's plenty of random female characters scattered throughout. I haven't seen DRS2P2 yet but I expect it'll be more of the same. I should mention I also made a chart with the reverse (two named men in an episode who talk about eachother about something besides a woman). Only three episodes fail in any capacity. (Say thank you to the Akita, Pixal, and Harumi solo episodes). If you read this whole thing, thank you. I had a lot of fun doing it. Let me know if there's any other charts I can do!
99 notes
·
View notes
Text
IMDb Graphs 📉📈
For the week ending July 14:
He dropped 69 to spot 280. Nothing new to report.
Some others in that range: Chris Hemsworth at 230, Joel Edgerton at 293, Steve Carell at 274.
Sebastian Stan is at spot 982.

She went up 1,444 to spot 142. Mother Mary is now linked to her list of credits after some re-shooting. Look at that, work.

😂😂😂 someone really wants to have a new job. She's higher than Hemsworth. So I guess her birthday was a "clicking her profile" party?
Sydney Sweeney is up 7 to spot 18 this week.👏👏👏
Justin is down 44,727 to spot 164,911
Amanda is up 564,104 to spot 625,824
Joana is down 2,640 to spot 17,950
28 notes
·
View notes
Note
https://twitter.com/imlaraedwards/status/1793019510049460558?t=ZP3OdiCAa71DhCxGhAUgxA&s=19
The guy with the big camera, is that the pap person hired to take pics on set?
Usually paps are paid. Not always, but usually. Sometimes they get lucky. And I think the Atlanta one just tracks filming locations.
But the celebrities and paps know how much each need each other. But if you recall Britney Spears, Paris Hilton, Lindsay Lohan, etc in the early aughts. They couldn’t walk because they were surrounded by 20-30 paps. This helps not have that. It’s less dangerous for everyone involved.
Like Dakota, she’s casually been spotted almost everyday of filming. She has a movie Daddio coming out in June. If you watch @annislittleshopofhorrors IMDb graphs, you’ll know why she does pap walks.
3 notes
·
View notes
Text
Because I am very much neurodivergent, and enjoy spreadsheets, I found some info on the IMDb ratings of all the criminal minds episodes
The overall average is 7.480
100 and entropy are tied for top at 9.1
Future perfect is the lowest at 6.6 and is also that episode directly before entropy
Lowest to highest of seasons goes: 14 at 7.444, 13 at 7.521, 15 at 7.593, 6 at 7.603, 10 at 7.606, 12 at 7.660, 1 at 7.783, 8 at 7.795, 11 at 7.797, 5 at 7.812, 2 at 7.951, 7 at 7.957, 9 at 7.971, 3 at 8.023, and 4 at 8.039
But if you count ‘to hell’ and ‘and back’ as the same episode, season 4 gets bumped down a space with an average of 7.972
Without entropy, season 11 would be ranked between seasons 12 and 1
Season 9 has never really felt like a top season to me, but it’s so high mostly because none of its episodes rate below 7.4
9’s top episode is demons at 8.6
Top 10 ish episodes are Penelope, zugzwang, and demons at 8.6, fisher king part 2, Lauren, mr scratch, and date night at 8.7, revelations and Mosley lane at 8.9, and entropy and 100 at 9.1
Bottom 10 ish episodes are demonology, beyond borders, neon terror, submerged, all you can eat, and mixed signals at 7.0, internal affairs at 6.9, a good husband at 6.8, awake at 6.7, and future perfect at 6.6
Season 3 ranges from 7.4 for identity and higher power to 8.5 for lo-fi
The lowest 5 ish in season 4 are cold comfort at 7.5, house on fire and roadkill at 7.4, catching out at 7.3, and demonology at 7.0
The lowest 5 ish of season 14 are Luke, flesh and blood, and night lights at 7.4, broken at 7.3, and innocence and sick and evil at 7.2
The top 5 ish of season 4 are memoriam, conflicted, amplification, to hell, and and back at 8.4, and mayhem and omnivore at 8.5
The top 5 ish of season 14 are starter home and truth or dare at 7.6, twenty seven at 7.7, chameleon at 8.2, and 300 and the tall man at 8.3
Episodes directed by Matthew gray gubler have an average rating of 8.175
Here’s the little graph I made for it:
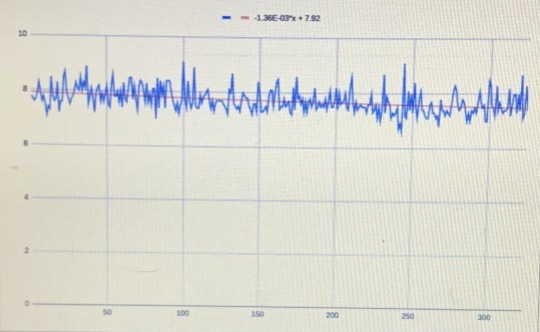
You see that weirdly flat bit around the 200s? That’s season 9
See that huge spike a little bit before 250? That’s entropy
I am deeply obsessed with my useless little math projects
#criminal minds#cm#episode#IMDb#episode ratings#statistics#graph#spreadsheet#neurodiversesquad#i am neurodivergent#self diagnosed autism#autism#the special interest half: criminal minds
46 notes
·
View notes
Text
Graph on IMDb ratings over the years by a long-running TV Show’s seasons
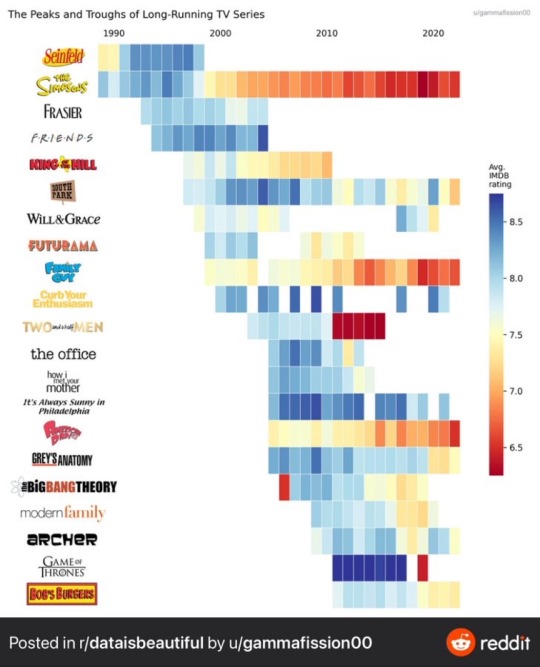
Look at Sunny… yeah. That’s my all time star

250 notes
·
View notes
Text
They’ve got another one, boys

Sites I like stop making garbage updates challenge
#I know some of you don’t like goodreads but the way it’s set up and designed was actually very helpful and fun for me#and just stellar organization wise#I had made a story graph account but it doesn’t have that same level of functionality or precision or focus level design I need#idk how to describe#but like now goodreads is also going to that more bubbly hard to focus on look same as Nanowrimo same as IMDb same as bookoutlet I hate it#why are all sites suddenly doing this#and why is this change wreaking so much havoc on my brain like why can’t I focus on it long#reverse terraforming making it hostile to human life
68 notes
·
View notes
Text
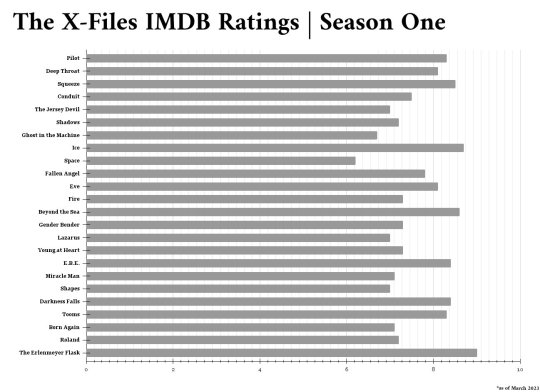
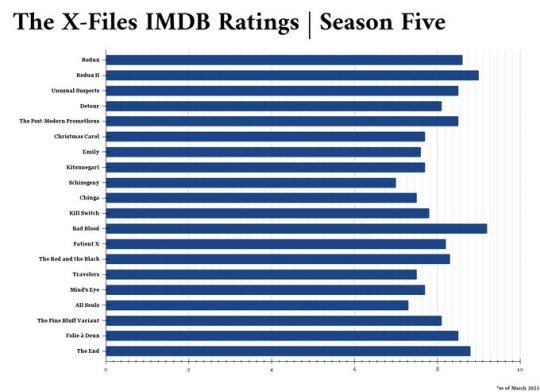
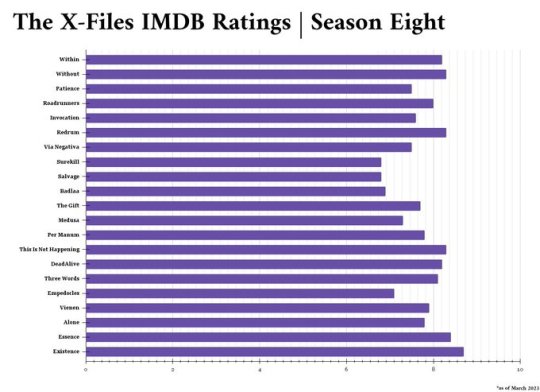
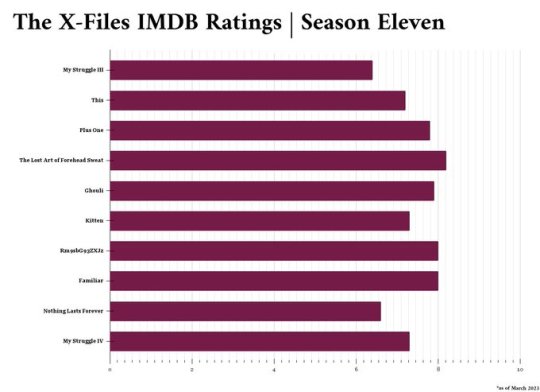
The Best and Worst Rated Episodes of The X-Files according to IMDB - a breakdown ✨
To kick things off, here’s a chart of the ratings for all 218 episodes in the series

Season One (1993-1994)
Highest Rated The Erlenmeyer Flask (9.0)
Lowest Rated Space (6.2)
Season Average (7.67)
Season Two (1994-1995)
Highest Rated Anasazi (9.1)
Lowest Rated Fearful Symmetry (6.5)
Season Average (7.84)

Season Three (1995-1996)
Highest Rated Clyde Bruckman’s Final Repose (9.2)
Lowest Rated Teso Dos Bichos (5.9)
Season Average (7.99)

Season Four (1996-1997)
Highest Rated Musings of a Cigarette Smoking Man (9.0)
Lowest Rated El Mundo Gira (6.6)
Season Average (7.95)

Season Five (1997-1998)
Highest Rated Bad Blood (9.2)
Lowest Rated Schizogeny (7.0)
Season Average (8.08)
Season Six (1998-1999)
Highest Rated Dreamland (9.0)
Lowest Rated Alpha (6.4)
Season Average (8.12)

Season Seven (1999-2000)
Highest Rated Requiem (8.6)
Lowest Rated Fight Club (6.0)
Season Average (7.61)

Season Eight (2000-2001)
Highest Rated Existence (8.7)
Lowest Rated Surekill (6.8) Salvage (6.8)
Season Average (7.77)
Season Nine (2001-2002)
Highest Rated The Truth (8.3) The Truth II (8.3)
Lowest Rated Lord of the Flies (6.9)
Season Average (7.47)

Season Ten (2016)
Highest Rated Mulder and Scully Meet the Weremonster (8.0)
Lowest Rated Babylon (6.4)
Season Average (7.38)

Season Eleven (2018)
Highest Rated The Lost Art of Forehead Sweat (8.2)
Lowest Rated My Struggle III (6.4)
Season Average (7.47)
Films ✨
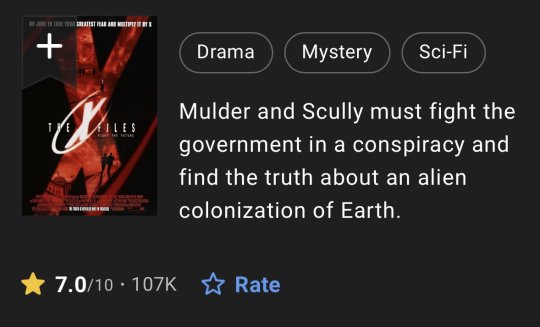
Fight the Future (1998) | 7.0
I Want to Believe (2008) | 5.9
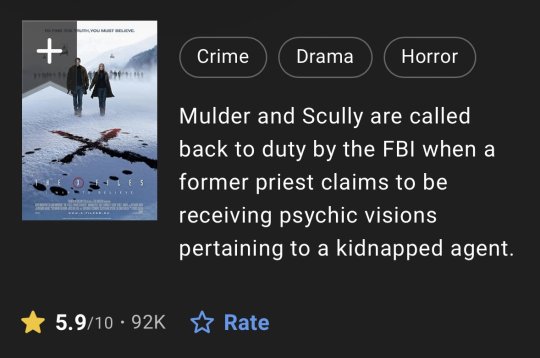
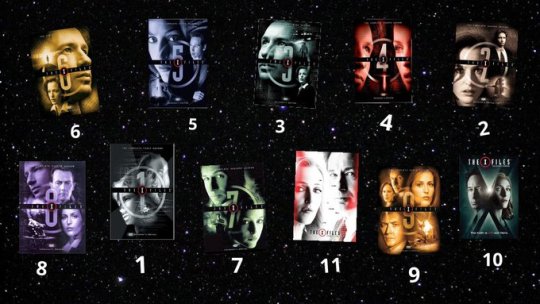
Averages Ranked ✨
Season Six (8.12) Season Five (8.08) Season Three (7.99) Season Four (7.95) Season Two (7.84) Season Eight (7.77) Season One (7.67) Season Seven (7.61) Season Eleven (7.47) Season Nine (7.47) Season Ten (7.38)
Series Average (7.81) IMDB Series Rating (8.6)
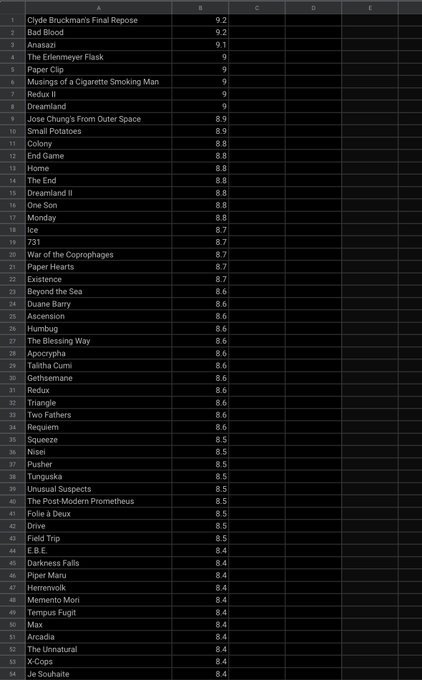
Top 10 Highest Rated Episodes
Clyde Bruckman’s Final Repose (9.2) Bad Blood (9.2) Anasazi (9.1) Dreamland (9.0) Redux II (9.0) Musings of a Cigarette Smoking Man (9.0) Paper Clip (9.0) The Erlenmeyer Flask (9.0) Small Potatoes (8.9) Jose Chung’s From Outer Space (8.9)
Bottom 12 Lowest Rated Episodes
Nothing Lasts Forever (6.6) Signs and Wonders (6.6) Teliko (6.6) Fearful Symmetry (6.5) My Struggle III (6.4) Babylon (6.4) Alpha (6.4) 3 (6.3) Space (6.2) First Person Shooter (6.1) Fight Club (6.0) Teso Dos Bichos (5.9)
[IWTB is also rated 5.9]

As of March 2023, The X-Files is the 110th Most Popular TV show on IMDB.
Unlike the Nielsen Ratings, these scores aren’t set in stone. Anyone can make an IMDB account and contribute their ratings, so if there’s anything you disagree with on the list, go represent your opinion!

All statistics from IMDB, all graphs created by me ✨
The data was obtained in March 2023, since IMDB ratings are subject to change, these findings may not be accurate in the future
However, with each episode currently having around 5k ratings, it’s likely not to vary too much.
Trends and Points of Interest✨
Season Three had both the highest rated episode (Clyde Bruckman at 9.2, tied with Bad Blood) and the lowest rated episode (Teso Dos Bichos at 5.9)
Despite being very high on the Nielsen charts, El Mundo Gira is one of the least popular episodes.
Season Three was the most featured on the “Most Popular” list (731, War of the Coprophages, Jose Chung, Paper Clip, Clyde Bruckman)
Despite being a beloved season, Season Four appeared the most on the “Least Popular” list (Teliko, The Field Where I Died, El Mundo Gira, Kaddish)
Here’s the full breakdown for anyone who’s curious to see where their favorite episode lands!
I hate math, but as far as my calculations go-
Mean: 7.81 Median: 7.8 Mode: 7.3 Range: 3.3


Anything that shocked you?
1) I can’t believe Musings of a Cigarette Smoking Man is so high
2) People are sleeping on Nothing Lasts Forever (it has one of the best MSR scenes!)
3) I know this is an unpopular opinion, but I don’t hate Fight Club. I’ve always liked Kathy Griffin
#the x files#x files#mulder#scully#msr#gillian anderson#david duchovny#chris carter#fox network#statistics
115 notes
·
View notes
Text
At this point HBO has to be just playing with us right because even from a data perspective ofmd is insanely good
Everyone else see the interview that came out this week where David and Taika pretty much said s1 ended in a place where a s2 was meant to begin?
Well, beside the fact that the show runners clearly intend for a second season, here are some factual reasons (I’m not going to go into sociological or artistic reasons because that’s a whole other essay) why Our Flag Means Death needs to be renewed:
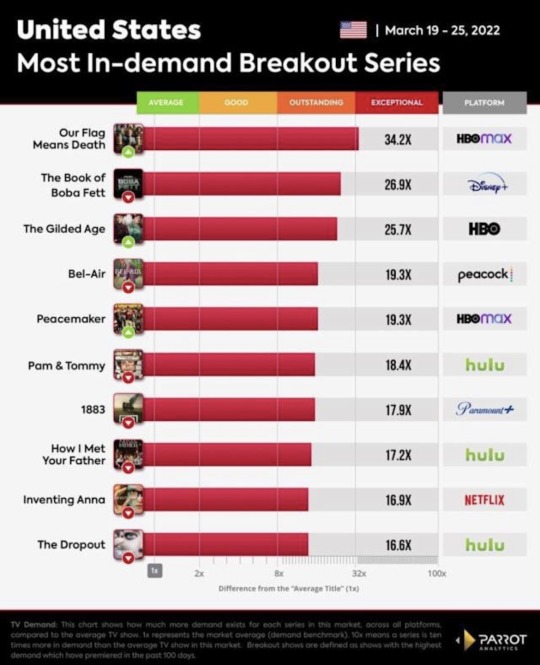
Demand tripled by the time the finale aired and has grown into a huge fandom presence even after its ending
Became the most in-demand show in the last 100 days (dethroning Boba Fett by quite a bit)
No. 11 in US/World, despite having limited exposure
(as a note for when I say it’s been sort of exclusive to the US, I just mean that some people have found it difficult to watch in their native countries, though they might have had access through other services (as I talk about later, OFMD is exclusive to HBO Max, which is different from even HBO, meaning it has limited streaming even in the US). The international popularity wasn’t necessarily intentional unlike some of their other shows and, most importantly, I unfortunately can’t find specifics on country-to-country streaming (because HBO Europe and Asia can be different than HBO US) and any data I reference is related to what I can find for the US. But if you’ve found it hard to find in your country or it’s been easy/recently added, feel free to comment)
Here are some graphs showing the demand/ratings for the show as well if you want something more visual (cred@221Bcrow on twt and Parrot Analytics because I had trouble finding the original data and they’re nice graphs and I’m sorry if they’re blurry just know the top line is OFMD)

Not only are those numbers good, but this has been done with (from what I can tell) average to below-average marketing from HBO
If you want specifics, I included some data I gathered on the show’s promotions vs. ratings based on its rate of occurrence on the HBO Instagram accounts (I’m sorry I couldn’t do Twitter it was too much work) and ratings on popular sites like Rotten Tomatoes and IMDb. I compared OFMD to Winning Time, which acts as a representative of other current HBO shows, since it had a similar start date, is one of their most advertised series, and has already been renewed (even though the final figures aren’t out yet for WT). I did NOT choose it to garner any hatred towards the show, which I think is important to point out since it is also a well-produced series from what I know and the creators deserve respect. Anyway, here’s the data:
Release
OFMD: March 3rd, 2022 - March 24, 2022 (10 episodes)
WT: March 6th, 2022 - present (6 episodes)
Ratings
OFMD:
90% critics score (top critics and average critics score were the same) on RT
95% audience score on RT
8/10 on IMDb (out of 11,660 reviews)
WT:
84% average critics score (72% top critics score) on RT
82% audience score on RT
8.5/10 on IMDb (out of 5,464 reviews)
(just for reference, CODA, which won Best Picture at the Oscars this year, has RT scores of 94% (critics) and 91% (audience) and an IMDb score of 8.1/10, though obviously from a much larger sample)
Promotions
(for this, I literally went through the main and HBO Max Instagram accounts and documented how many times a post related to either show appeared (rate of occurrence); there is probably a margin of error of +/- 1 post, but seeing as the numbers are pretty different this shouldn’t impact the conclusion; you can count it yourself too if you like lol)
[HBO Max Instagram]
(Started at posts dating back to March 1st, 2022; the total number of posts is 321)
OFMD: 21 times (6.54%)
WT: 31 times (9.66%)
[HBO Instagram]
(Started at posts dating back to February 9th, 2022; the total number of posts is 252)
OFMD: 0 times
WT: 32 times (12.70%)
(in case you didn’t know, HBO and HBO Max are actually two different services. HBO is a cable network, which still comes with TV bundles and can be bought through services such as Hulu, but HBO Max is HBO’s streaming platform that hosts extra content. HBO Max shows are not really mentioned through HBO the channel since they don’t air on it, as shown by the official HBO media accounts not including any mention of OFMD but heavily promoting WT)
IN CONCLUSION
Even from my non-HBO-professional pov OFMD is a very special show and the facts reflect that. I don’t even have all that much included here. As opposed to WT, one of HBO’s frontline series right now that has already been renewed, OFMD was not streamed or promoted through HBO’s main channel and had average SNS marketing (similar to Minx, another ongoing show that had a 5.30% rate of occurrence on the HBO Max account but a smaller presence overall). It has not just produced extremely positive ratings and gathered an extremely large audience (not to mention all the inclusivity and happiness it has also brought), but has done so with little conscious help from HBO. Honestly, a lot of the promotion for OFMD probably came from people randomly posting about it through tumblr and twt in addition to the casts’s/staff’s wonderful interviews, which is crazy to think about. I don’t personally enjoy Euphoria, but knowing the show’s extremely popularity, I think the fact alone that OFMD was able to top its ratings despite the mitigating factors should be a huge indication the show requires a second season immediately (and maybe a third too?)
The petitions have already begun for good reason and if you need more evidence past it being one of the purest romances ever to support the show’s renewal, then here are some fancy numbers for you
#this was done a while ago but I mean it’s still true#HBO it’s really not funny now#I did too much but this show needs to be renewed at all costs#ofmd#our flag means death#blackbeard#edward teach#stede bonnet#ofmd spoilers#stedeward#blackbonnet#blackstede#gentlebeard#ofmd finale#ofmd lucius#ofmd s2#izzy hands#black pete#ofmd jim#frenchie#oluwande#rhys darby#taika waititi#wee john ofmd#david jenkins#ofmd meta#renew our flag means death
298 notes
·
View notes